Knowing how to read cryptocurrency charts is incredibly useful for traders to find opportunities in the market. Performing technical analysis doesn’t have to always be complicated — you can start by recognizing a few chart patterns for information. This article will walk you through how to read crypto charts so you can make informed trading decisions and track the direction of prices.
What are Cryptocurrency Candle Charts?
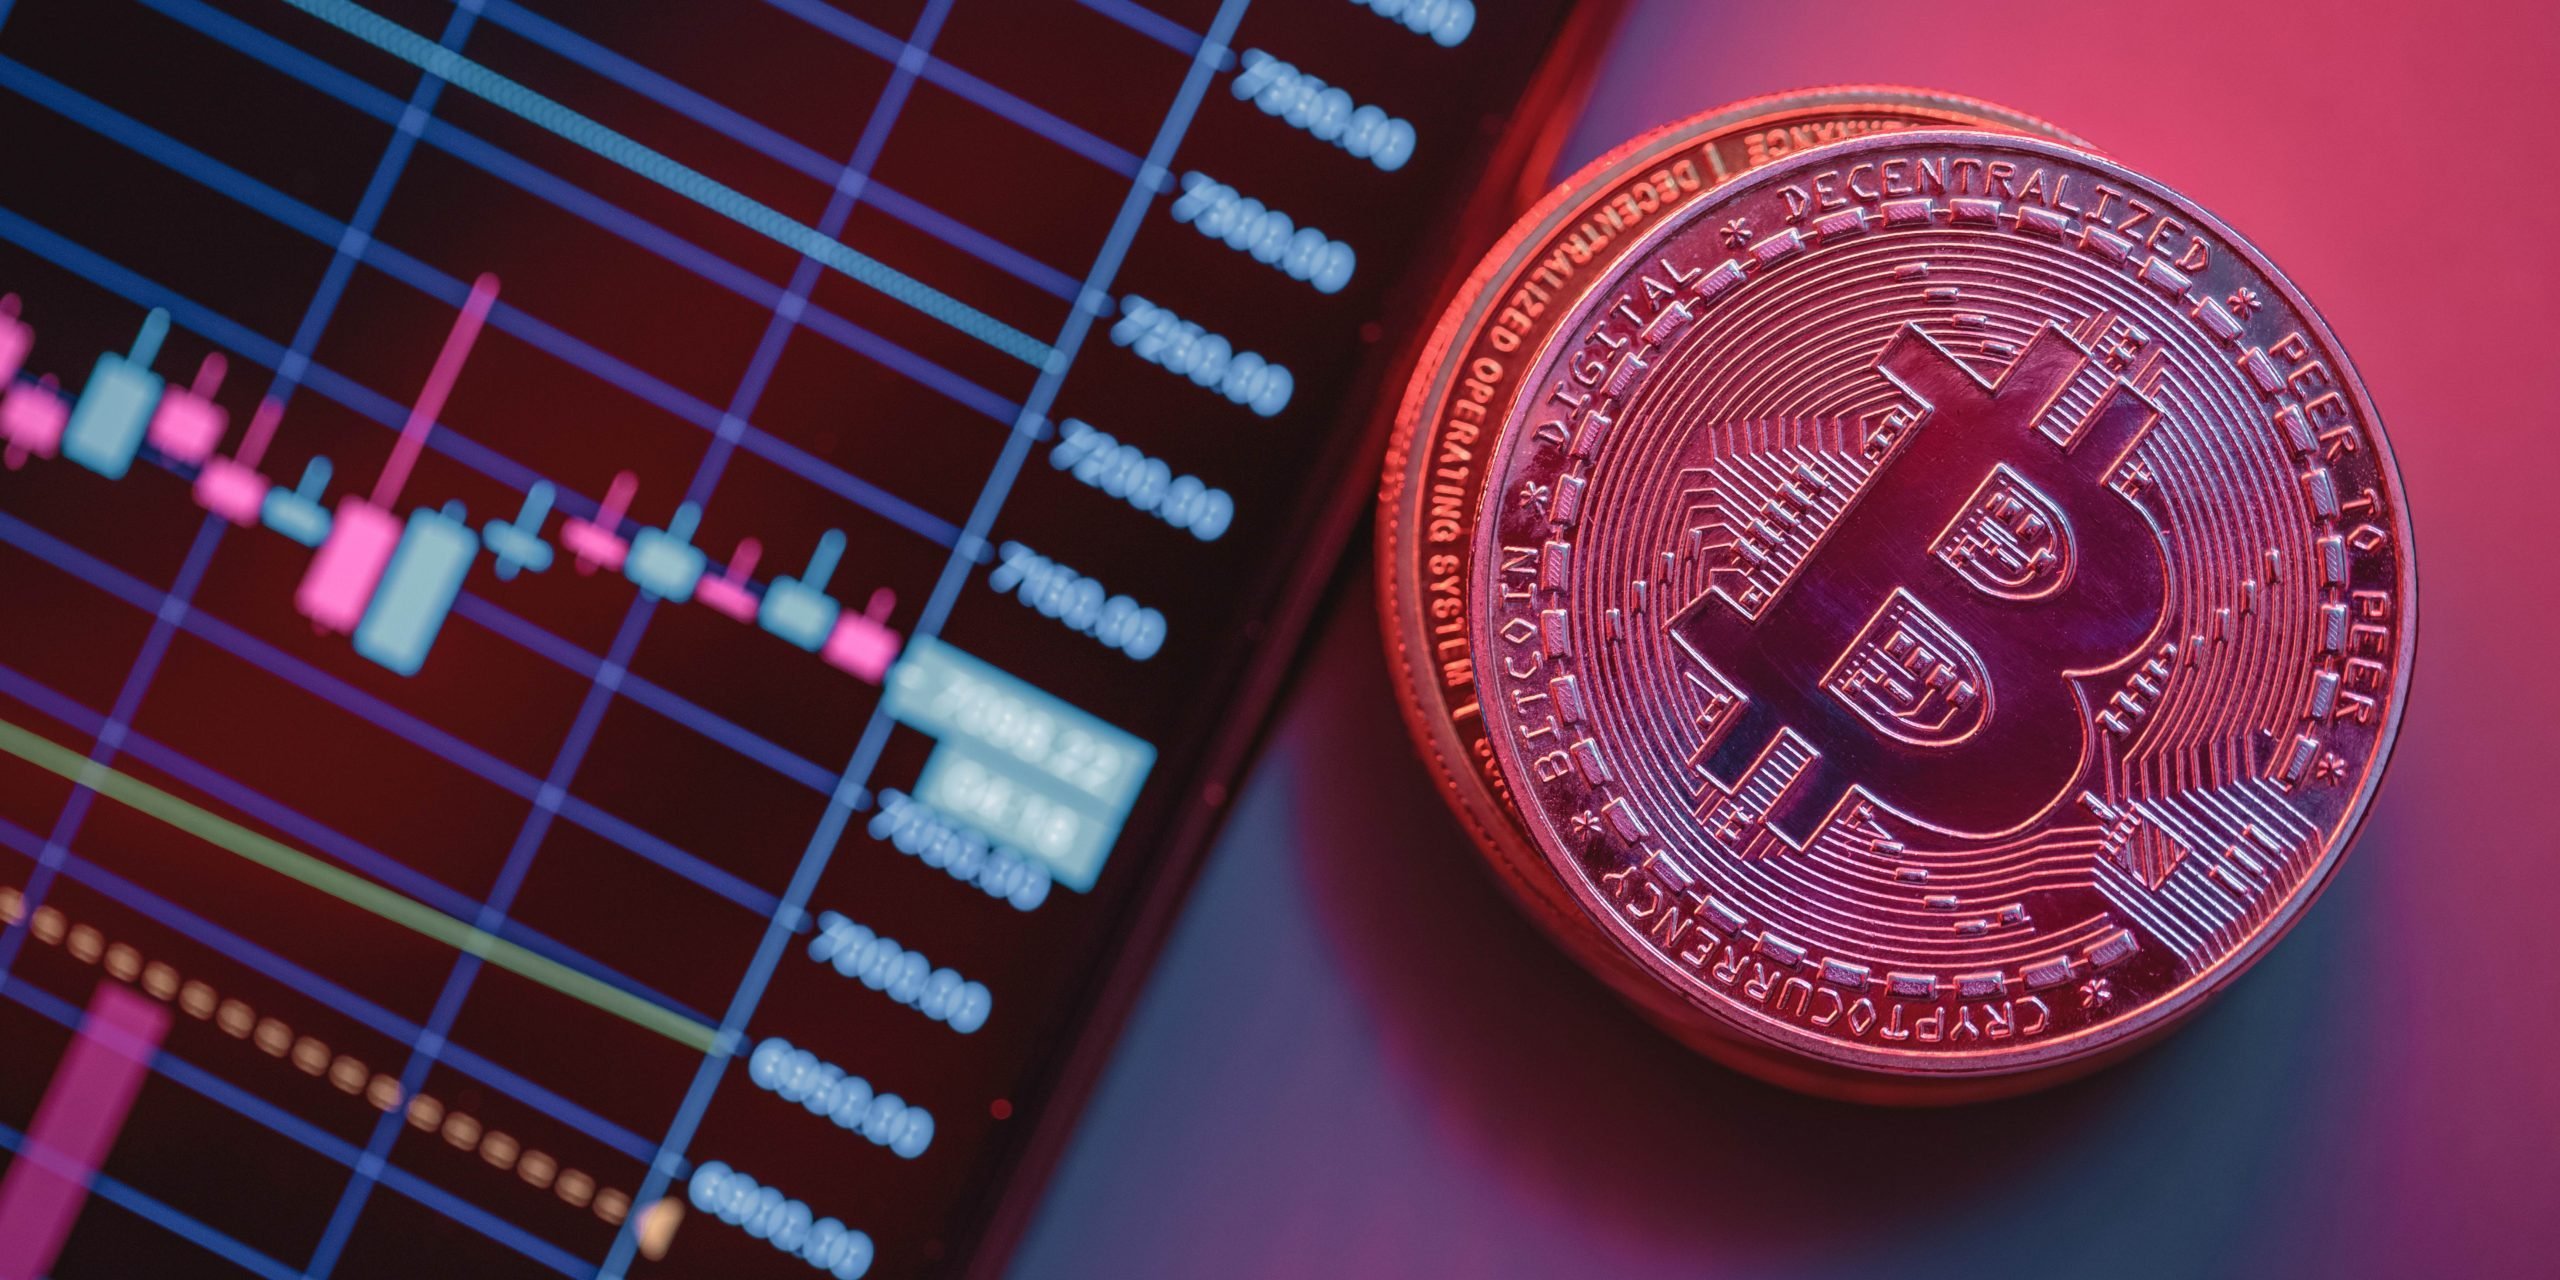
A cryptocurrency candle chart shows the price movements of crypto over a time period. These price movements are displayed in the form of candles, which have a rectangular body shaped like a bar representing the opening and closing price, as well as a line indicating the low and high price of the day. Shading (like red or green) applied to the body of the candle indicates whether the close was higher than the open or vice versa.
Understanding Cryptocurrency Charts
To understand crypto charts, you need to familiarize yourself with several trading terms. Here’s a rundown of some of them.
Trading Pair
Cryptocurrencies that are traded for one another through an exchange are referred to as trading pairs. Because some cryptocurrencies may only be bought using other cryptocurrencies, trading pairs are useful in facilitating trading. A trading pair can provide access to other cryptocurrencies that cannot be bought directly with fiat money.
Current Price
Current price refers to the last traded price of a cryptocurrency. Because cryptocurrencies trade live 24 hours a day, the prices fluctuate. When you place a trade (buy or sell), chances are you may not buy at the last traded current price, but possibly slightly higher or lower depending on supply and demand.
High/Low
High/low price levels are the highest and lowest points a cryptocurrency trades within a specific time frame. Bear in mind that high/low varies across time frames. For example, the high in a one-minute chart would differ from the high in a weekly chart.
24-Hour Volume
The 24-hour volume indicator measures the total volume of a cryptocurrency traded in the last 24 hours. Traders use this indicator to measure the market’s interest in a particular cryptocurrency. If the 24-hour volume is high, it indicates high interest in the cryptocurrency. A low 24-hour volume indicates low interest.
Unit of Time
This is the timeframe of trading activity on a cryptocurrency displayed on the chart. For example, a one-minute chart displays the price movements and actions of the cryptocurrency every minute. Likewise, a 15-minute chart displays the price movements of a cryptocurrency every 15 minutes. You can select and adjust the unit of time you want from as little as one minute to as much as a month.
Price Chart
This shows the fluctuation in a cryptocurrency’s value over time. In a price chart, a candle or line is used to represent the price movement of a cryptocurrency over a period. The timeframe can also be adjusted depending on your trading strategy or technical analysis.
Trading Volume
This indicator shows the volume of a cryptocurrency that has been traded within a specified timeframe. It is usually displayed in bars and correlates with the pattern on the price chart. Long bars indicate high trading volumes compared to other periods, while short bars indicate lower trading volumes. A green bar indicates a price increase, while a red bar indicates a price drop.
How to Read Crypto Chart Trends and Indicators
The ability to read a crypto chart is essential to trading profitably. To do this effectively, you need to be able to recognize trends and use chart indicators.
Crypto Chart Indicators
Crypto chart indicators give you clues about how the market is trading a particular cryptocurrency. Traders use chart indicators to visualize the price action of a cryptocurrency, enabling them to determine the best way to trade. Here are some indicators that can help when reading crypto charts.
Moving Averages
A moving average is the average price of a cryptocurrency over a set period. Because they show the average price of an asset over time, moving averages filter out short-term fluctuations. As a result, moving averages help identify overall trends and establish key support and resistance levels that can determine entry and exit points.
Support and Resistance Level
Support and resistance are price levels on a chart that indicate a cluster of buying or selling, often appearing to limit the price range.
Supports are usually price levels with a concentration of buy orders. The price of the cryptocurrency may drop until it reaches support levels and regularly rebound from those levels. Support levels can be entry points for traders. Resistance levels are conversely the levels with a high concentration of sellers (or sell orders). Traders usually use resistance levels to determine their exit points.
These zones may be technical or psychological. Technical support and resistance zones are those that are established by chart patterns and trend lines. Psychological zones are those that are influenced by human emotion, such as round numbers, 52-week highs and all-time highs and lows.
Crypto Chart Patterns
Chart patterns are distinct shapes within a price chart that are formed based on the trading activity of an asset within a certain timeframe. Chart patterns give an indication of what the price may do next based on its previous activity. These appear in cryptocurrency charts and offer specific insight.
Shooting Star
A shooting star is a candlestick pattern that forms when the price of the security opens, rises significantly, but then closes near the open price. It is usually regarded as a sign of bearish reversal by traders because the closing price ends up converging toward its lower opening price. This usually suggests that sellers (bears) have taken over, and prices of the asset may drop.
Hammer
A hammer is a candlestick pattern that occurs when an asset trades significantly lower than its opening but rises to near the opening price. The candlestick forms a hammer-like shape in which the lower wick (the line beneath the candle) is longer than the size of the candle body. Because the asset’s price fell below its opening price but later rebounded, buyers regained control. Hammers are regarded as a bullish reversal candlestick pattern.
Head and Shoulders
Head and shoulders is a candlestick pattern that indicates a trend reversal. There is a peak (shoulder), then a higher peak (head) that is followed by a lower peak (shoulder). Traders use the head and shoulders to predict a shift from a bullish pattern to a bearish pattern. Head and shoulders patterns can also form in an inverted position signaling a shift in trend from bearish to bullish.
Wedges
A wedge occurs when the price range (distance between high and low prices within a certain time frame) shrinks and becomes narrower. When trend lines are drawn above and below the price range, they converge into an arrow shape. Traders use wedges to spot a reversal or continuation of price action.
Learn Charting For Crypto (cryptocurrency charts)
Crypto trading is fast-paced, and any type of edge is useful. Through the use of technical indicators, it is possible to recognize trends and patterns in price charts. However, no single chart pattern can always accurately predict the direction of prices. To get the best out of your chart reading, try to use a combination of different indicators.
Frequently Asked Questions
What is a good indicator for crypto?
A good indicator for crypto is using a combination of indicators, although they aren’t guaranteed to predict price action.
How do you analyze cryptocurrency before buying?
You can analyze cryptocurrency before buying by looking for support and resistance levels and reviewing technical indicators. You can also consider crypto project fundamentals and relevant news events.
Where can I find a crypto chart?
There are a number of advanced charting tools that exist. The BitcoinIRA desktop and mobile app contains pricing information and charts users can take advantage of.


 3,500+ 5-Star Reviews